
What we’re showing
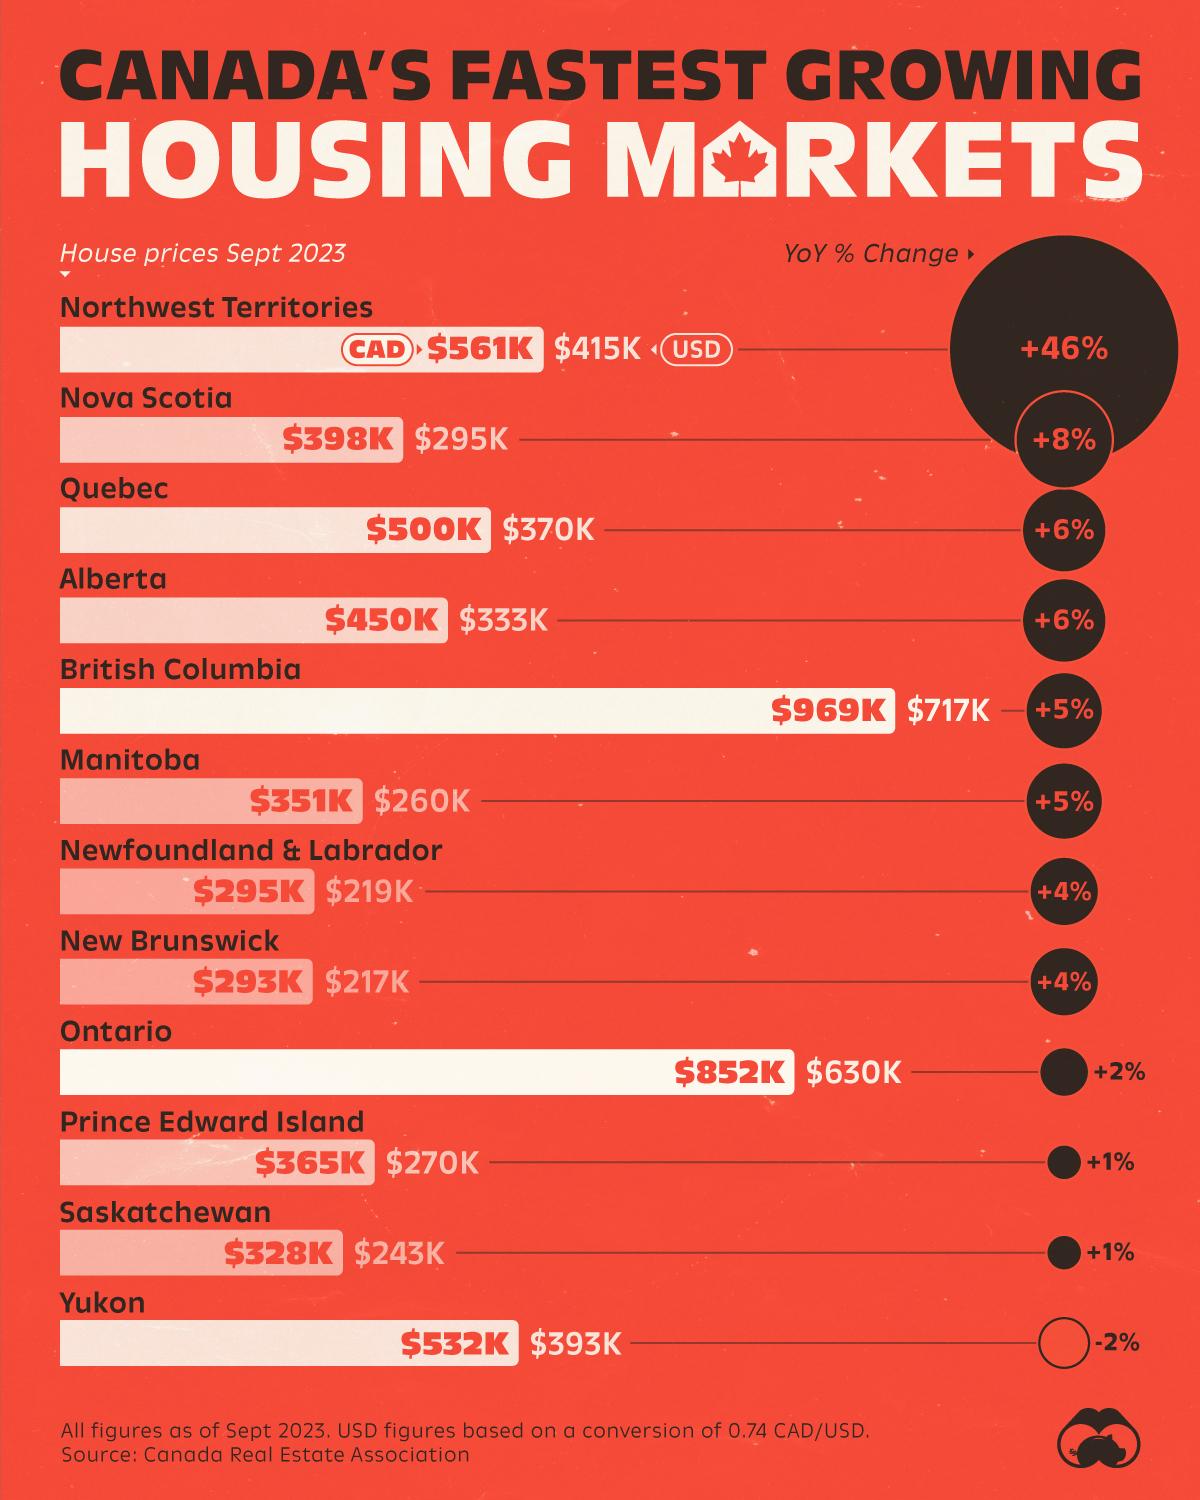
The average price of a house across Canada’s provinces and territories (excluding Nunavut), based on data from the Canada Real Estate Association. Nunavut was not included in this analysis.
Key takeaways
| Province / Territory | Sept 2022 (CAD thousands) | Sept 2023 (CAD) | YoY % Change | Sept 2023 (USD thousands) |
|---|---|---|---|---|
| Northwest Territories | 385 | 561 | 46 | 415 |
| Novia Scotia | 370 | 398 | 8 | 295 |
| Quebec | 470 | 500 | 6 | 370 |
| Alberta | 425 | 450 | 6 | 333 |
| British Columbia | 922 | 969 | 5 | 717 |
| Manitoba | 335 | 351 | 5 | 260 |
| Newfoundland & Labrador | 285 | 295 | 4 | 219 |
| New Brunswick | 281 | 293 | 4 | 217 |
| Ontario | 836 | 852 | 2 | 630 |
| Prince Edward Island | 362 | 365 | 1 | 270 |
| Saskatchewan | 325 | 328 | 1 | 243 |
| Yukon | 541 | 532 | -2 | 393 |